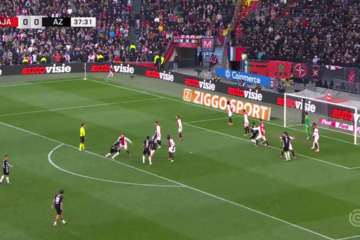
In modern football, set-pieces have moved from afterthoughts to strategic weapons. But to improve your team’s output from corners, free kicks, and throw-ins, there’s one thing you need before tactics: measurement.
A KPI dashboard isn’t just a nice-to-have—it’s the backbone of a data-informed set-piece approach. Below is a step-by-step framework to build one that helps you monitor, optimize, and evolve your set-piece performance.
1. Define the Objectives of Your Set-Piece Dashboard
Every metric should serve a purpose. Ask yourself:
Do we want to increase goal output from set-pieces?
Are we aiming to tighten our defensive structure?
Do we want to measure execution consistency of rehearsed routines?
By setting clear objectives, your dashboard becomes a tactical tool, not just a data display.
2. Segment Your KPIs Into Functional Categories
To gain meaningful insights, structure your KPIs into three main blocks:
A. Offensive KPIs
These track your team’s ability to turn set-pieces into scoring chances:
Goals scored from corners and free kicks
xG from set-pieces
Delivery accuracy into specific zones (e.g., far post, 6-yard box)
First-contact win percentage
Conversion rate per routine (e.g., near-post flick, central run, second-phase shot)
Second-ball recovery rate—often overlooked, but crucial
B. Defensive KPIs
These assess how well your team defends against opponent set-plays:
Goals conceded and xGA from set-pieces
Opponent’s first-contact win rate
Shots allowed per 10 defensive set-pieces
Zone vulnerability (where do most threats come from?)
Conceded routines (short corners, overloads, direct deliveries)
C. Execution & Tactical KPIs
Measure internal consistency and tactical discipline:
Routine execution accuracy
Delivery precision per set-piece taker
Blocker success rate (clearing space without fouling)
Target player involvement (headers, duels, goals)
Variation index (how often different routines are used)
3. Visualize to Recognize Patterns
Dashboards work best when they are visually clear. Use heatmaps for target zones, graphs to show trends over time, and player dashboards for role-specific stats (e.g., your main aerial threat, your screener, your short-option receiver).
Example visualization tools:
Excel/Google Sheets (for static dashboards)
Tableau or Power BI (for dynamic, shareable dashboards)
Tactical boards to annotate routines with outcomes
4. Use KPIs to Guide Set-Piece Decisions
A high xG but low goal conversion? Revisit finishing and positioning.
Low delivery accuracy? Change your taker or work on technique.
Too predictable? Introduce new routines or rotate patterns.
KPI insights should feed directly into:
Training focus areas
Routine selection on matchday
Opponent-specific planning
5. Don’t Forget to Track the Second Phase
Many goals don’t come from the initial contact—they come from the second phase. Track:
Ball recovery zone
Number of passes until shot
Final shooter positioning
This helps you identify hidden contributors and optimize your rest-defense positioning.
6. Continuous Feedback Loop
Make your dashboard part of the post-match review. Encourage players to engage with their own metrics—especially those in specialized roles like blockers, screeners, or throw-in targets.
The best set-piece teams don’t just prepare—they adapt and improve through data.
Conclusion: The Tactical Edge You Can Build
Building a KPI dashboard is not about overwhelming your team with numbers—it’s about bringing structure, clarity, and accountability to your set-piece plan.
When every player knows what’s measured, they start to focus on the details that matter. When coaches can track trends, they can make smarter, faster decisions.
In the end, what you measure is what you can master.

0 reacties